Root cause analysis emerges as a discipline that blends logic, evidence, systems thinking, and human insight to help leaders and professionals uncover why problems truly occur—and how to stop them from returning. By combining traditional tools such as 5 Whys, Fishbone diagrams, Pareto analysis, and statistical validation with advanced methods like FMEA, FTA, Bow-Tie, Barrier Analysis, STAMP/STPA, and Causal Loop Modeling, organizations gain a holistic view of failures across technical, human, and systemic layers. The material underscores that modern challenges—AI-enabled systems, healthcare operations, education networks, and industrial automation—demand deeper scrutiny than linear causation can offer. Effective RCA becomes a mindset of curiosity, discipline, and humility, supported by structured workflows, robust CAPA execution, and predictive technologies. The ultimate outcome is operational resilience, reduced waste, safer environments, and healthier teams—an ecosystem where learning replaces blame, and improvement becomes a shared responsibility.
ವ್ಯಕ್ತಿಗತ ಕುಸಿತಗಳು, ಮರುಪ್ರಾರಂಭದ ನೋವುಗಳು ಮತ್ತು ದಾರಿತಪ್ಪಿಸುವ ವಿಫಲತೆಗಳನ್ನು ಶಕ್ತಿಯಾಗಿ ಪರಿವರ್ತಿಸುವ ಒಳನೋಟಗಳನ್ನು ಒಂದೇ ಸಮೇತ ಹಿಡಿದಿಟ್ಟಿರುವ ಈ ಸಂಕ್ಷಿಪ್ತ ಸಾರಾಂಶವು, ಉದ್ಯಮಶೀಲತೆಯಲ್ಲಿನ ಗಟ್ಟಿ ಮನೋಭಾವ, ಕಠಿಣ ಪರಿಶ್ರಮ, ಆಧ್ಯಾತ್ಮಿಕ ಬಲ ಮತ್ತು ವ್ಯವಸ್ಥಿತ ಚಿಂತನೆಗಳ ಸಂಯೋಜನೆಯ ಮಹತ್ವವನ್ನು ತೋರಿಸುತ್ತದೆ. ಕಠಿಣ ಸತ್ಯಗಳನ್ನು ಎದುರಿಸಲು, ಧೈರ್ಯದಿಂದ ಮರುನಿರ್ಮಿಸಲು ಮತ್ತು ಅರ್ಥಪೂರ್ಣ ಯಶಸ್ಸನ್ನು ಸಾಧಿಸಲು ದಾರಿದೀಪವಾದಂತೆ ಮಾರ್ಗದರ್ಶನ ನೀಡುವ ಈ ದೃಷ್ಟಿಕೋಣ, ತನ್ನ ಕನಸುಗಳನ್ನು ಕೈಬಿಡದೇ ಮುಂದುವರಿಯುವ ಪ್ರತಿಯೊಬ್ಬರಿಗೂ ಸ್ಫೂರ್ತಿಯಾಗಿದೆ.

Popular Root Cause Analysis Methods
Introduction
Root Cause Analysis (RCA) matters because it is one of the few disciplines that helps leaders permanently eliminate recurring problems rather than endlessly firefight them. When done correctly—grounded in systems thinking, human factors, and rigorous evidence—it becomes a transformational capability that upgrades entire organizations. Below is a detailed, professional, multidisciplinary introduction that sets the foundation for the full article.
A. Intended Audience and Purpose of the Article
This article is crafted for readers who are responsible for making systems safer, smarter, and more resilient—whether those systems involve people, machines, data, or social environments. It speaks directly to:
- Leaders who want to stop the cycle of firefighting and build a culture of intelligent problem-solving.
- Engineers and quality professionals seeking structured, evidence-backed tools to reduce defects and waste.
- System designers who need frameworks for anticipating failures before they propagate.
- Healthcare administrators responsible for patient safety, clinical processes, and risk mitigation.
- Educators aiming to prevent systemic breakdowns in learning environments or institutional processes.
- Social-impact entrepreneurs building scalable, reliable, people-centered solutions.
Purpose:
The purpose is to offer a comprehensive, multidisciplinary view of Root Cause Analysis (RCA)—one that blends:
- Practical industry applications
- Systems theory
- Safety engineering methods
- Insights from foundational works such as Robert Latino’s Root Cause Analysis and Nancy Leveson’s Engineering a Safer World
Readers will walk away with a deeper understanding of failure mechanisms, analytical tools, and how to design corrective actions that actually stick.
Why this matters:
Organizations often treat symptoms, not causes. This article helps readers break that pattern by learning how to:
- Identify and validate fundamental contributors
- Map complex causal chains
- See beyond individual error into the surrounding system
- Build structures that minimize risk and maximize long-term reliability
Ultimately, the goal is to help readers create resilient, humane, sustainable systems that serve communities, customers, and society—aligning directly with the mission of MEDA Foundation to build self-sustaining ecosystems and uplift people with dignity.
B. Defining Root Cause Analysis
RCA is not about who messed up—it’s about what the system allowed or enabled. At its heart, RCA is a disciplined process for uncovering the deeper mechanisms behind undesirable outcomes.
What RCA really is:
Root Cause Analysis is a structured, evidence-driven method used to identify the fundamental factors that, when corrected, prevent the recurrence of problems. It aims for permanent resolution, not temporary suppression.
Drawing from Robert Latino’s seminal work:
- RCA is not a “blame tool.”
- It is a learning and discovery tool.
- It helps organizations examine facts, timelines, interactions, and contributing conditions.
Latino emphasizes that effective RCA requires:
- Detailed event chronology
- Verification of causal links
- Understanding human and organizational factors
- Avoiding assumptions or convenient narratives
Layers of causes:
RCA distinguishes between:
- Proximate causes – the most visible triggers (“the machine overheated”).
- Intermediate causes – conditions that allowed the trigger (“cooling system was not maintained”).
- Root causes – systemic or structural factors (“lack of preventive maintenance culture, poor scheduling, inadequate resources”).
Most organizations stop too early—usually at the first or second layer—leading to repeated failures. This article pushes readers to dig deeper until they reach factors that truly drive recurrence.
C. Reactive vs. Proactive RCA
Strong organizations do both—they solve the problems of today and anticipate the failures of tomorrow.
1. Reactive RCA
Reactive RCA addresses failures after they occur.
Questions include:
- “What happened?”
- “Why did it happen?”
- “What conditions allowed it?”
- “How do we prevent this exact problem from recurring?”
Essential for industries like healthcare, aerospace, manufacturing, and public safety where failures carry high risk.
2. Proactive RCA
Building on Nancy Leveson’s Engineering a Safer World and the STAMP/STPA framework:
Proactive RCA identifies vulnerabilities before failures occur by examining:
- System controls
- Communication pathways
- Unsafe interactions
- Hidden dependencies
- Control structure weaknesses
Instead of asking “What caused the failure?”, it asks:
- “Where is the system fragile?”
- “What could go wrong under the right (or wrong) conditions?”
- “How do we build barriers that prevent accidents even when humans or components fail?”
This shifts the mindset from reaction to systemic foresight.
3. Balancing Both
High-reliability organizations—airlines, nuclear plants, top-tier hospitals—do not choose between reactive and proactive methods. They treat both as continuous cycles of improvement.
This dual approach:
- Reduces firefighting
- Increases resilience
- Builds safety and reliability into the DNA of the organization
- Prevents small issues from becoming catastrophic failures
A balanced RCA strategy is the foundation of operational excellence.
D. Overview of RCA Methods
No single RCA method is sufficient. Each has strengths—and blind spots. A powerful RCA integrates multiple methods to see the problem from different angles.
1. Logical Methods
- 5 Whys
- Why-Why Analysis
These help break down a problem simply and quickly. They work well for linear issues but fail when the system is complex or nonlinear.
2. Visual / Structural Methods
- Fishbone (Ishikawa) Diagram
- Fault Tree Analysis
- Bow-Tie Analysis
These methods help teams map relationships, categorize contributing factors, and visualize risk pathways.
3. Statistical Methods
- Pareto Analysis
- Scatter Plots
- Regression Analysis
These are used when the issue has measurable variation or when data patterns reveal underlying relationships.
4. Systemic Methods
Grounded in systems theory and safety engineering:
- FMEA (Failure Modes & Effects Analysis)
- Barrier Analysis
- Nancy Leveson’s STAMP/STPA (System-Theoretic Accident Model & Processes)
- Causal Loop Modeling (Systems Thinking)
These methods capture complex interactions, feedback loops, and socio-technical dynamics.
5. Why Multi-Method RCA Wins
Single-tool RCA is like diagnosing illness with only a thermometer. Multidisciplinary RCA:
- Reduces cognitive bias
- Separates symptoms from system flaws
- Provides a 360° view of the problem
- Yields more reliable, durable corrective actions
This article will show readers how to select the right tool—or combination of tools—for each type of problem.

II. 5 Whys Technique: The Power of Lean Thinking
The 5 Whys remains one of the simplest and most elegant tools for uncovering causal chains, but it is also one of the most misused. When applied with rigor, humility, and real-world observation—as Taiichi Ohno intended—it sparks deep learning. When used casually, it creates illusions of understanding and leads organizations straight into oversimplification. This section unpacks the real power—and real limits—of the 5 Whys.
A. Origin in Toyota Production System (Ohno’s Principles)
The 5 Whys emerged from the Toyota Production System (TPS), a philosophy that revolutionized manufacturing by combining respect for people with relentless elimination of waste. At its heart are two foundational pillars:
- Jidoka – building quality into the process so problems surface immediately
- Kaizen – continuous, incremental improvement through local intelligence
1. Central to Jidoka and Kaizen
The 5 Whys became indispensable at Toyota because it aligned perfectly with these principles. Instead of waiting for defects to accumulate, employees were empowered to pause operations, observe directly, and ask “Why?” repeatedly until the underlying condition—not just the symptom—was revealed. It democratized problem-solving, making every worker a guardian of quality.
2. Ohno’s Emphasis on Simplicity and Gemba
Taiichi Ohno’s genius was not in creating a complex tool, but in promoting deep thinking through simple practice. He believed:
- Most critical insights emerge from Gemba—the actual place where work happens.
- Human learning is superior to any statistical sophistication when diagnosing everyday operational issues.
- Tools should teach people to think rather than shield them from thinking.
Ohno was known to say that if the analysis didn’t make people uncomfortable, they hadn’t dug deep enough. The discomfort is where learning begins.
B. Methodology
The 5 Whys works only when rooted in evidence, direct observation, and disciplined questioning. Without that, it becomes a guessing game dressed up as analysis.
1. Repeated Questioning to Trace Linear Causal Chains
The method is straightforward:
- Define the problem precisely.
- Ask “Why did this happen?”
- Answer based on verified evidence, not assumption.
- Ask “Why?” again based on that answer.
- Continue until the underlying systemic or process-level factor is exposed.
This works best when:
- The problem has a linear cause-effect relationship.
- The team has access to real-time facts, not hearsay.
- The environment allows open, safe inquiry.
2. How to Avoid Cognitive Bias, Anchoring, and Premature Closure
Most failures of the 5 Whys come from mental shortcuts, not method flaws. Common traps include:
- Anchoring: jumping to a comfortable explanation and building all “Whys” around it.
- Confirmation bias: seeking evidence that supports a preconceived narrative.
- Premature closure: stopping the inquiry as soon as blame becomes convenient.
- Solution bias: steering the “Whys” toward a preferred corrective action.
To avoid these traps:
- Start with Gemba observation, not conference-room discussion.
- Validate each “Why” with data, photos, logs, or firsthand accounts.
- Involve a cross-functional team—not just the person closest to the problem.
- Demand multiple alternative explanations before accepting one.
A 5 Whys done well resembles a scientific investigation; done poorly, it resembles office gossip.
C. Pros and Cons
The 5 Whys is brilliant for simple problems and useless for complex ones—unless enhanced and integrated with other tools.
1. Pros: Quick, Intuitive, and Culturally Transformative
- Fast and low-cost: no software, statistics, or experts required.
- Promotes humility: forces teams to challenge surface-level assumptions.
- Builds curiosity: employees learn to think and observe like investigators.
- Improves culture: empowers teams to own quality and process integrity.
This is why Toyota embedded it across all levels, from line workers to senior managers.
2. Cons: Insufficient for Complex Socio-Technical Problems
As Nancy Leveson argues in Engineering a Safer World, many modern systems—healthcare, software, aviation, robotics—are nonlinear and interdependent, where:
- Multiple causes interact
- Failures arise from system structure, not sequences
- Human error is a consequence, not a cause
In such environments, the 5 Whys can become dangerously simplistic. It risks:
- Overshooting the real systemic factor
- Blaming individuals instead of contexts
- Missing hidden feedback loops
- Creating false confidence
For healthcare administrators, social systems, or automation engineers, the 5 Whys should never be the sole method.
3. Enhancements to Strengthen the 5 Whys
To make the 5 Whys more reliable and robust:
- Combine with timeline analysis
Helps clarify sequence, timing, and interactions. - Use observation-based data (Gemba Walks)
Ensures every “Why” is grounded in fact. - Perform team-based questioning
Diverse perspectives reduce cognitive bias. - Add Fishbone or Causal Loop Diagrams
Allows mapping of multiple contributing factors. - Verify each causal step with evidence
If a “Why” cannot be proven, it must be challenged.
Properly enhanced, the 5 Whys becomes a gateway to deeper RCA—not a standalone tool.
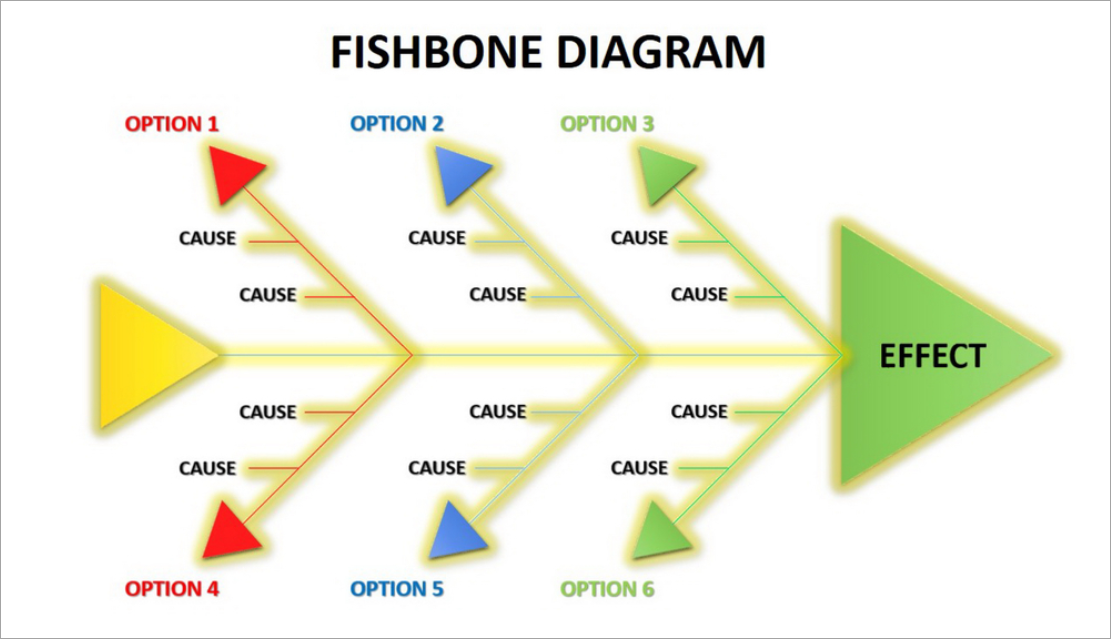
III. Fishbone (Ishikawa) Diagram: Multi-Category Causal Exploration
The Fishbone Diagram is one of the most powerful tools for mapping the many intertwined factors behind complex problems—but only when built with discipline, evidence, and cross-functional participation. Otherwise, it becomes a messy wall poster filled with guesses. Below is a detailed and actionable explanation of its origin, structure, methodology, and best practices.
A. Origin and Structure
The Fishbone Diagram—also known as the Ishikawa Diagram or Cause-and-Effect Diagram—originated from Kaoru Ishikawa, one of the leading architects of Japan’s Total Quality Management (TQM) movement.
1. Inspired by Ishikawa’s Quality Circles and Japanese TQM
Ishikawa believed that quality is everyone’s responsibility, not just management’s. His quality circles—small employee groups that met regularly to solve problems—needed a structured way to map causes collaboratively.
The Fishbone Diagram emerged as a visual, intuitive method for:
- Organizing complex, multi-dimensional problems
- Encouraging inclusive participation
- Revealing patterns that are not apparent through linear tools like the 5 Whys
It quickly became foundational to Japanese quality culture and is still used globally across manufacturing, healthcare, education, engineering, and service operations.
2. Categories Used: 5M/6M, 8P, 4S/5S
Ishikawa designed the diagram to accommodate category-based thinking, enabling teams to consider a broad spectrum of possible contributors.
Common structures include:
- 5M / 6M (Manufacturing & Engineering)
- Man (People)
- Machine
- Method
- Material
- Measurement
- Mother Nature (Environment) – added as the 6th M
- 8P (Marketing & Service)
- Product
- Price
- Place
- Promotion
- People
- Process
- Physical Evidence
- Performance
- 4S / 5S (Service & Administration)
- Surroundings
- Suppliers
- Systems
- Skills
- (Safety as a fifth element in some contexts)
These variations allow the Fishbone to adapt across industries and problem domains.
B. Methodology
The Fishbone works best when it is treated as a structured investigation, not a random brainstorming exercise. Every branch must be built on validated observations, not speculation.
1. Brainstorming Causes, Organizing Branches, and Drilling Down
The methodology typically follows three layers:
- Define the problem clearly
Poorly defined problems produce useless diagrams. - Brainstorm causes under each category
Use sticky notes, whiteboards, or digital tools. - Drill deeper using 5 Whys
Each cause should be expanded horizontally until it connects to actionable factors. - Validate connections with data
This is where most organizations fail—they assume rather than verify.
2. Rejecting Assumptions and Prioritizing Data
Drawing on Borror’s Certified Quality Engineer (CQE) Handbook, the Fishbone must be grounded in:
- Direct observations
- Process data
- Time studies
- Control charts
- Gemba findings
- Voice-of-customer reports
- System logs or maintenance records
Any cause added without evidence is an opinion, not a fact.
Any cause that cannot be validated should be removed or flagged as “needs verification.”
This transforms the Fishbone from a guess map into a reliable diagnostic tool.
C. Strengths, Weaknesses, Best Practices
The Fishbone is unmatched for exploring multi-factor problems—but its value comes from disciplined execution, not the diagram itself.
1. Strengths: Excellent for Complex Multi-Factor Problems
- Captures broad categories of contributing factors
- Helps teams visualize relationships
- Reveals patterns and clusters
- Encourages cross-functional dialogue
- Works well for problems where causes span people, processes, tools, environment, and systems
It is especially useful in:
- Manufacturing failures
- Healthcare errors
- Service delays
- Customer complaints
- Education process breakdowns
- Social or community-level system issues
2. Weaknesses: Risks and Common Failures
The tool has limitations when poorly executed:
- Noisy brainstorming: too many vague ideas without structure
- Misclassification: causes placed in wrong categories
- Unvalidated assumptions: a major flaw highlighted in Borror’s CQE Handbook
- Lack of prioritization: all causes look equal
- Groupthink: dominant personalities shaping the diagram
Ultimately, the Fishbone is a framework—not a truth. It depends entirely on the quality of investigation.
3. Best Practices for High-Quality Fishbone Analysis
To ensure the diagram delivers real insight:
- Evidence tagging:
Each cause should be labeled as:- Verified (✓)
- Needs validation (?)
- Assumption (A)
- Differentiate opinions vs. facts:
Color-code sticky notes or digital entries to visually separate them. - Stakeholder diversity:
Include representatives from:- The process
- Upstream inputs
- Downstream customers
- Quality/engineering
- Leadership when needed
The more perspectives, the less bias.
- Use data sources intelligently:
Validate each branch with real measurements, logs, observations, or customer evidence. - Avoid too many categories:
Select a category structure that fits the industry and keeps thinking focused. - Iterate the diagram:
The first version is rarely correct; refine as evidence accumulates.
When done well, the Fishbone Diagram becomes a living hypothesis map that guides deeper RCA and identifies where further investigation is needed.
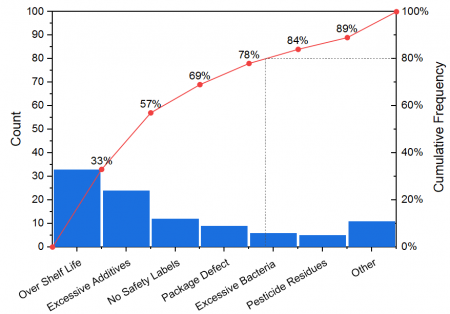
IV. Pareto Chart: Prioritizing the Vital Few
The Pareto Chart is one of the most strategic tools in quality engineering because it instantly directs attention to the small number of causes that create the majority of problems. When organizations feel overwhelmed by “too many issues,” the Pareto Chart restores clarity and focus. However, its usefulness depends entirely on data quality and thoughtful interpretation—not blind obedience to the 80/20 rule.
A. Foundation in Quality Engineering
1. Origin in Vilfredo Pareto’s Economic Distributions; Widely Applied in TQM and Six Sigma
The concept dates back to Vilfredo Pareto, an economist who observed that 80% of Italy’s land was owned by 20% of the population. This asymmetry—later called the Pareto Principle or the 80/20 rule—appears repeatedly across economics, population studies, business, reliability engineering, and failure analysis.
In Total Quality Management (TQM) and Six Sigma, the Pareto Chart became essential because:
- Most problems usually stem from a small cluster of root causes.
- Most failures originate from a few flawed processes or systemic weaknesses.
- Most customer complaints arise from predictable issues.
This principle streamlines improvement efforts by identifying where interventions will deliver the greatest impact.
2. Value Emphasized in Borror’s Certified Quality Engineer (CQE) Handbook
The CQE Handbook underscores that the Pareto Chart is a powerful tool for:
- Ranking categories of defects
- Guiding limited resources to the most significant problems
- Preventing “analysis paralysis”
- Supporting evidence-based prioritization
Rather than chasing every issue, teams learn to act with precision.
B. Methodology
The Pareto Chart delivers value only when the underlying data is reliable, consistently collected, and appropriately categorized.
1. Sorting Issues by Frequency or Magnitude
The process begins by gathering data (weekly defects, monthly complaints, audit findings, downtime events, etc.) and categorizing them into meaningful groups.
Common metrics include:
- Frequency (how often something occurred)
- Impact (cost, time lost, severity, customer dissatisfaction)
- Weighted scores combining frequency and severity
Then the categories are sorted in descending order—the largest bars first.
2. Using Cumulative Distributions to Identify Top Contributors
The Pareto Chart adds a cumulative percentage line, showing the point at which you reach:
- 50% of impact
- 80% of impact
- 90% of impact
This makes it visually obvious which categories form the “vital few” and which are the “trivial many.”
For example:
- Three categories may represent 78% of total defects.
- The remaining seven categories contribute only 22%.
This guides leaders to invest energy where improvement will actually matter.
C. Pros, Cons, Applications
1. Pros: Simple, Strategic, Helps Allocate Limited Resources
- Simplicity: Easy for teams and executives to understand at a glance.
- Strategic clarity: Reveals the most influential contributors.
- Efficient decision-making: Ideal when resources (time, money, manpower) are limited.
- Supports continuous improvement: Repeated Pareto analyses show whether interventions worked.
2. Cons: Backward-Looking, Dependent on Data Quality
Despite its power, the Pareto Chart has limitations:
- It depends heavily on historical data—which might not predict future failures.
- Poor categorization leads to misleading results.
- It may hide subtle but emerging risks.
- Rare but catastrophic events may not appear as a “vital few” but still require action.
- The 80/20 rule is a pattern, not a law—blind assumptions can be dangerous.
In fields like healthcare, aviation, or nuclear operations, a rare event with catastrophic potential must not be ignored simply because it doesn’t dominate the chart.
3. Applications: Defect Reduction, Customer Complaints, Process Improvement
The Pareto Chart is versatile and widely used across industries:
- Manufacturing: identifying top defect types or process bottlenecks
- Healthcare: analyzing medication errors, patient complaints, safety incidents
- Service industries: isolating common delays or quality failures
- IT Operations: tracking outage causes, support ticket categories, security alerts
- Education: identifying recurring issues in student performance or administrative failures
- Social-impact domains: understanding systemic patterns in community challenges or service delivery gaps
Across all these areas, the chart transforms large datasets into a compelling strategic narrative.

V. Scatter Plot, Regression, and Statistical RCA Tools
Statistical tools bring discipline, objectivity, and quantification to Root Cause Analysis—but only when paired with domain expertise and contextual understanding. These tools can validate whether a suspected relationship is real or merely an illusion, helping teams avoid guesswork. However, they are not magic; without proper interpretation, they can produce misleading narratives and false confidence.
A. Purpose
1. Validating Suspected Cause–Effect Relationships
Scatter plots and regression models serve one core purpose:
to test whether two variables move together in a meaningful way.
When teams believe, for example, that:
- higher humidity increases defect rates,
- low staff levels predict patient wait-time spikes,
- machine temperature influences product variation, or
- training frequency affects error reduction,
statistical tools help confirm or refute these hypotheses.
Scatter plots provide the quick visual test.
Regression provides the mathematical evidence.
Together, they help teams move from “we think” to “we know.”
2. Quantifying Correlations and Understanding Patterns
Key benefits reinforced in the CQE Handbook and quality engineering literature include:
- Identifying strength and direction of relationships (positive, negative, or none).
- Quantifying the degree of association (correlation coefficient).
- Predicting outcomes using regression equations.
- Detecting non-linear patterns, clusters, or outliers.
- Enabling evidence-based decisions on whether a suspected cause is worth deeper investigation.
This elevates RCA from intuition-driven problem solving to data-driven insight generation.
B. Limitations
1. Correlation ≠ Causation — A Core Principle Emphasized in the CQE Handbook
One of the most repeated cautions in statistics—and particularly highlighted in the Certified Quality Engineer (CQE) Handbook—is:
Just because two variables move together does NOT mean one causes the other.
Examples of misleading correlations include:
- Ice cream sales and drowning incidents (both rise in summer).
- Employee overtime and product defects (both may rise due to understaffing, not because overtime “causes” defects).
- Machine runtime and maintenance costs (age or workload might be the true cause).
Without examining context, mechanism, and process knowledge, teams risk mistaking coincidence for causality.
2. Requires Grounding in Domain Knowledge to Avoid Spurious Conclusions
Statistical tools do not understand processes—humans do.
Without domain expertise:
- Random noise may be misinterpreted as a relationship.
- Outliers might be ignored when they actually signal system failure.
- Regression models may be overfitted, creating false patterns.
- Important variables may be missing, giving the illusion of correlation.
In complex socio-technical systems (such as healthcare, manufacturing, education, or public service), numbers alone cannot explain:
- human behavior,
- decision logic,
- latent conditions, or
- organizational pressures.
Thus, statistical RCA must always be combined with:
- operational insights,
- process mapping,
- observational data,
- timeline analysis, and
- systems thinking.

VI. Failure Mode and Effects Analysis (FMEA): Predictive Reliability
A. Foundation and Evolution
- Origins in High-Reliability Systems
- First developed by U.S. aerospace and NASA programs in the 1950s–60s to pre-empt component failures before flight missions.
- Adopted heavily in military standard MIL-P-1629A and later became the foundation for modern reliability engineering.
- Industry Expansion and Standardization
- Automotive sector formalized FMEA through AIAG standards; latest AIAG–VDA FMEA provides a global, harmonized methodology.
- Healthcare, manufacturing, medical devices, and energy sectors adopt variants such as HFMEA, PFMEA, DFMEA, and SFMEA.
- The CQE Handbook reinforces its role as a proactive tool in design and process control, emphasizing its alignment with preventive quality philosophy.
B. Methodology
- Structured Breakdown of Risk
- Identify system or process functions → enumerate potential failure modes → determine effects → analyze causes → review existing controls.
- This ensures no failure is evaluated in isolation—each follows a chain of function → deviation → outcome.
- Scoring and Prioritization
- Traditional method uses Severity (S), Occurrence (O), and Detection (D) scores to compute Risk Priority Number (RPN).
- AIAG–VDA method replaces RPN with Action Priority (AP), which ranks issues based on severity-led logic rather than multipliers.
- More emphasis on expert judgment, real-world controls, and process robustness rather than on numeric gaming.
- Action Workflow
- Identify high AP items → assign recommended actions → evaluate effectiveness → re-score parameters → close loop.
C. Limitations and Modern Improvements
- Inherent Problems with RPN
- RPN suffers from rank reversal, where different combinations of S, O, D produce misleading equivalence.
- Multiplied scores imply mathematical meaning where none exists; ordinal scores cannot be treated as continuous scales.
- Encourages gaming — teams may adjust scores to reduce RPN without truly reducing risk.
- How Action Priority (AP) Improves Consistency
- AP places Severity as the primary decision factor (rightly so — “low occurrence doesn’t make a catastrophe acceptable”).
- More realistic branching logic → fewer false negatives → clarity on where action is mandatory, recommended, or optional.
- Supports more meaningful communication across cross-functional teams.
- FMEA Cannot Handle Systemic, Interaction-Based Failures
- As systems grow complex (autonomous systems, software-heavy processes), failures often arise from interactions, not components.
- FMEA is inherently linear and component-centric, making it blind to higher-order dynamics.
- Should never be the only tool for software-intensive or socio-technical systems.
D. Book-Based Insight
- Leveson’s STAMP/STPA Perspective (from Engineering a Safer World)
- Leveson argues that complex systems fail not because components fail, but because control structures break down.
- Her STAMP model frames safety as a control problem, not a reliability problem.
- FMEA fails to capture:
- feedback loops
- unsafe interactions
- system-level constraints
- organizational factors
- STPA (System-Theoretic Process Analysis) extends analysis into:
- unsafe control actions
- dysfunctional interactions
- human–automation mismatch
- software constraint violations
- For high-complexity systems, FMEA should be integrated with STPA, FTA, or scenario-based risk simulations.
- The CQE Handbook Perspective
- Highlights that FMEA remains valuable for:
- identifying early design weaknesses
- reducing process variability
- building preventive controls
- But stresses the need for complementary methods for multi-factor failures, rare events, and systemic risks.
- Highlights that FMEA remains valuable for:
E. Applications Across Sectors
- Product Design (DFMEA)
- Material failures, tolerance stack-ups, interface mismatches, design for manufacturability.
- Process Design (PFMEA)
- Process stability, machine capability, human error modes, supplier variations.
- Healthcare (HFMEA/SFMEA)
- Medication errors, surgical workflow, patient safety systems.
- Software and Automation
- Identifying potential failure states in algorithms, control sequences, or sensor fusion logic (although STPA is increasingly preferred here).
- Service and Business Processes
- Error-prone workflows, customer journey failures, operational risks.
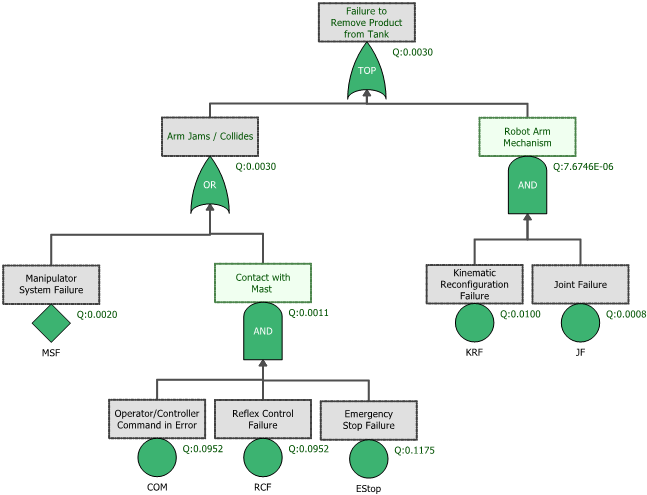
VII. Fault Tree Analysis (FTA): Deductive Logic for Failure Pathways
A. Logical Foundation
- Origins in High-Stakes Safety Engineering
- Developed at Bell Laboratories in 1962 for the U.S. Air Force’s Minuteman missile program, later expanded in nuclear power, aerospace, and military safety.
- Designed to analyze catastrophic events by breaking them down into structured, logical pathways.
- Boolean Logic as the Analytical Engine
- Uses AND, OR, k-out-of-n gates and other logic constructs to represent combinations of failure events that lead to the top event.
- Enables translating real-world engineering complexity into clean logic diagrams that highlight how multiple causes can converge into one failure.
- Formalization in Industry Standards
- Adopted into NRC, NASA, IEC 61025, ISO 26262 (automotive), and DO-178/254 (aviation).
- The CQE Handbook emphasizes its role in risk quantification, redundancy validation, and designing fault-tolerant systems.
B. Application
- Analyzing Catastrophic or Single-Point Failures
- Ideal when the objective is to understand exactly how a serious or mission-critical failure can occur.
- Effective for failures that must be prevented at all costs:
- loss of containment
- loss of braking
- uncommanded flight surface movement
- cybersecurity breach leading to unsafe behavior
- medical equipment malfunction
- Helps uncover minimal cut sets, i.e., smallest combinations of failures that cause the top event.
- Quantifying Failure Probabilities
- Allows calculation of the probability of the top event using failure rates from components, subsystems, or environmental factors.
- Supports Monte Carlo simulations, rare event modeling, and probabilistic risk assessment (PRA).
- Widely used in nuclear safety (WASH-1400), aviation system safety assessments, and chemical process hazard analysis.
- Supports Design of Redundancy and Safety Architectures
- Highlights where redundancy works — and where it doesn’t.
- Shows hidden single-point failures and dependency weaknesses.
- Assists in evaluating fail-safe designs, voting logic, and safety interlocks.
C. FTA vs. FMEA
- FTA = Deductive, Top-Down
- Starts with a top event (system failure).
- Works backward to identify all combinations of lower-level failures that could cause it.
- Excellent for:
- critical events
- system-level interactions
- compliance with regulatory safety cases
- validating safety architecture and redundancy
- FMEA = Inductive, Bottom-Up
- Starts from individual components or process steps and explores what can go wrong at each point.
- Excellent for:
- detailed design
- early-stage development
- process-level controls
- identifying common failure modes before they spread
- Why They Are Best Used Together
- FMEA uncovers many small issues; FTA shows how a few of them can combine into disasters.
- FMEA finds what can go wrong; FTA reveals how failures interact.
- FMEA improves component reliability; FTA improves system safety.
- Together they offer horizontal + vertical completeness, providing a far richer picture of risk.
D. Book-Based Insight (Leveson & CQE Handbook)
- Leveson’s System-Theoretic Critique
- FTA assumes failures propagate via linear cause–effect chains.
- In complex, software-driven systems, accidents often arise from:
- unsafe control actions
- feedback loop errors
- synchronization breakdowns
- organizational drift
- emergent interactions
- STPA (System-Theoretic Process Analysis) complements FTA by examining control structures, not just failure pathways.
- CQE Handbook Perspective
- Reinforces FTA’s strength in probability modeling and top-event decomposition.
- Stresses its role in risk communication and decision-making.
- Encourages using FTA along with FMEA, reliability block diagrams (RBD), and process controls for comprehensive coverage.
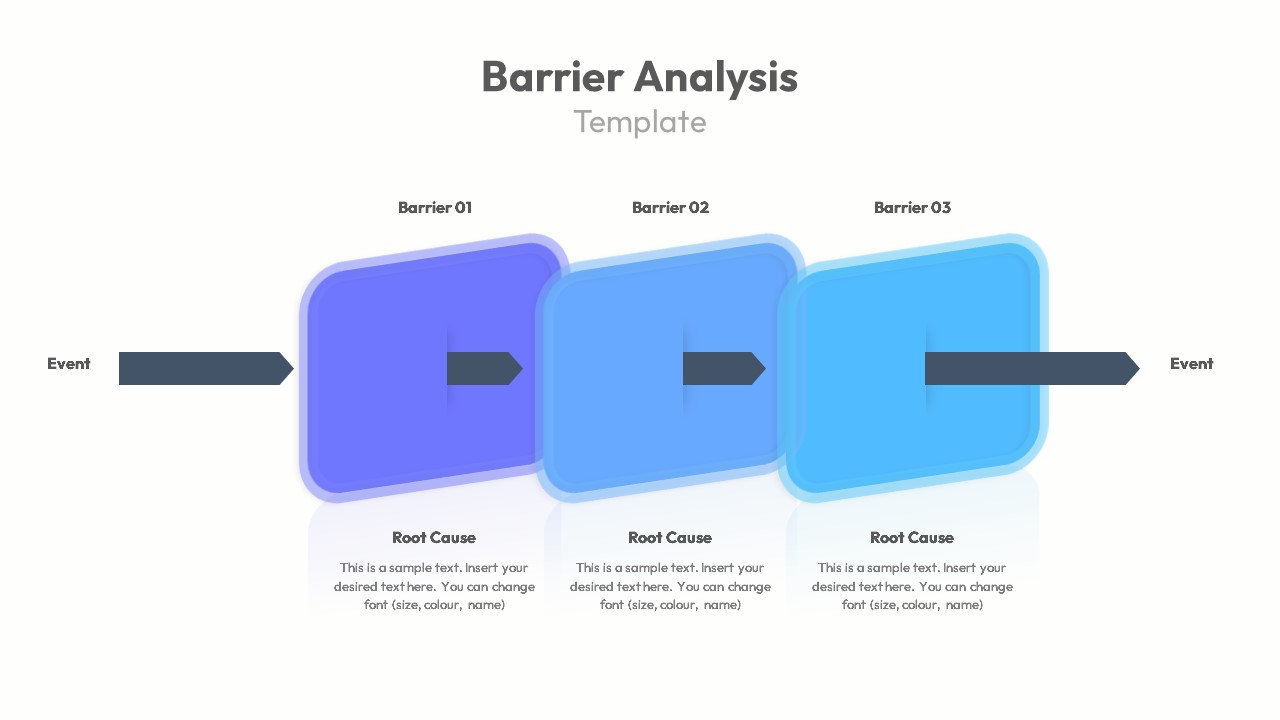
VIII. Barrier Analysis: Controls, Defenses, and Human Factors
A. Derived from Safety Engineering and Human Reliability Theory
- Foundations in System Safety and Defense-in-Depth
- Barrier Analysis is rooted in the principle that accidents occur when hazards breach one or more layers of defense, a concept formalized in early nuclear safety and later in aviation and chemical industries.
- It aligns with the classic “Swiss Cheese Model” (Reason) but extends beyond it by assessing barrier quality, availability, and degradation mechanisms.
- Integration with Engineering a Safer World (Leveson)
- Nancy Leveson emphasizes that barriers are control actions and constraints that keep systems within safe operating envelopes.
- Accidents arise not merely from component failure but from inadequate enforcement of safety constraints, making barrier analysis essential in evaluating system control structures.
- Barriers exist at multiple levels: physical, procedural, informational, supervisory, cultural, and regulatory.
- Human Reliability Theory Influence
- Humans interact with—and sometimes override—barriers. Barrier Analysis investigates how operator awareness, workload, training, and incentives influence barrier performance.
- Instead of assigning “human error,” it asks: What conditions, pressures, or design flaws made the human response predictable?
B. Types of Barriers
Barrier Analysis categorizes defenses into multiple layers, each addressing different aspects of system behavior:
- Technical Barriers (Engineering Controls)
- Physical or automated mechanisms designed to prevent hazards from manifesting.
- Examples:
- pressure relief valves
- interlocks and lockout systems
- machine guards
- fail-safe and fail-operational designs
- redundancy and isolation mechanisms
- These are often the most reliable—but also the most expensive—barriers.
- Human Barriers (Operator and Intervention Controls)
- Crucial when systems require human judgment, monitoring, or intervention.
- Examples:
- operator skill and situational awareness
- manual emergency shutdown actions
- monitoring, alarms, and decision-making
- Human barriers are highly variable and degrade under fatigue, overload, distraction, or poor interface design.
- Organizational Barriers (Structural and Cultural Controls)
- These define how industries and organizations structure authority, learning, and accountability.
- Examples:
- safety culture
- leadership commitment
- staffing and workload policies
- communication pathways
- incentive systems
- Many catastrophic failures (NASA Challenger/Columbia, Bhopal, BP Texas City) resulted from organizational barriers eroding.
- Administrative Barriers (Procedural Controls)
- Written rules, SOPs, checklists, permits, inspection requirements, and training plans.
- Often the most fragile because they rely heavily on consistent human compliance.
- Effective only when:
- realistic
- updated
- embedded in daily work
- supported by supervision and accountability
C. Evaluating Barrier Effectiveness
Barrier Analysis is driven by four critical questions. Each transforms vague blame into actionable insight:
- Did the Barrier Exist?
- Was there a formal control? Was it documented, installed, communicated, or mandated?
- Many incidents occur because the barrier never existed—a design or planning oversight.
- Was the Barrier Functional?
- If it existed, was it operational at the time of the event?
- Failures arise due to:
- maintenance gaps
- sensor drift
- disabled safety systems
- outdated procedures
- lack of staffing
- This identifies reliability and lifecycle management issues.
- Was the Barrier Bypassed?
- Human or automated actions intentionally or unintentionally circumvented the control.
- Common reasons include:
- “workarounds” to reduce friction
- pressure to meet schedules or production targets
- poor interface design
- false alarms or nuisance alerts
- These reveal misaligned incentives or design-induced failures.
- Was the Barrier Inadequate?
- The barrier existed and functioned, but its design was insufficient.
- Examples:
- alarm thresholds too narrow or too broad
- guards that protect against common hazards but not rare failure modes
- SOPs with ambiguous instructions
- automated systems without clear fallback logic
- This reveals deeper systemic weaknesses that require redesign, not just repair.
D. Best Suited For Incident Investigations and Safety-Critical Sectors
Barrier Analysis is especially powerful in industries where failure has severe consequences:
- Aviation (ICAO, FAA, EASA investigations)
- Healthcare (wrong-site surgery, medication errors, alarm fatigue)
- Chemical and Process Safety (OSHA PSM, CCPS frameworks)
- Energy and Nuclear (defense-in-depth, reactor safety)
- Transportation (rail, maritime, road safety cases)
- Oil & Gas (barrier-based risk models such as Bow-Tie analysis)
- Industrial Manufacturing (machine guarding, automation safety)
Its value lies in examining not just what failed, but why layers of protection did not prevent the failure. This shifts organizations away from blaming operators and toward strengthening system resilience.

IX. Bow-Tie Analysis: A 360° View of Threats and Consequences
A. Combination of FTA (Left Side) and Event Tree Analysis (Right Side)
- A Visual Integration of Two Powerful Logic Models
Bow-Tie Analysis sits at the intersection of deductive (FTA) and inductive (Event Tree) reasoning:- Left Side – FTA (Fault Tree Logic):
Identifies threats and causal pathways that can lead to a central hazardous event (the “Top Event”). - Right Side – Event Tree Logic:
Explores outcome pathways after the top event occurs, based on the success or failure of mitigative barriers.
- Left Side – FTA (Fault Tree Logic):
- The Central Node: The Hazardous Event
The bow-tie diagram is anchored by a single critical event (e.g., loss of containment, equipment failure, data breach, wrong-site surgery).
This central point is where risk becomes reality—and where both preventive and mitigative defenses must be scrutinized. - Why This Fusion Matters
Bow-Tie translates scattered risk concepts into a single, intuitive, and comprehensive picture:- threats → preventive barriers → hazardous event → mitigative barriers → consequences
This structure closes the loop and ensures nothing is overlooked between cause and effect.
- threats → preventive barriers → hazardous event → mitigative barriers → consequences
B. Application Across High-Risk and High-Complexity Sectors
- Oil & Gas and Petrochemicals
- Bow-Tie is part of the standard safety case approach in offshore drilling and refining (Shell, TotalEnergies, NORSOK).
- Used for managing major accident hazards like well kicks, blowouts, fires, and toxic releases.
- Helps visualize how operational barriers deteriorate under pressure.
- Aviation
- Deployed by ICAO, airlines, and aircraft manufacturers to map risks such as runway incursions, fuel contamination, or loss of separation.
- Supports crew resource management (CRM) by providing a shared mental model of threats and defenses.
- Critical for Safety Management Systems (SMS) and predictive risk monitoring.
- Healthcare
- Increasingly used for clinical risk management:
- medication mix-ups
- surgical errors
- hospital-acquired infections
- Integrates human factors, communication barriers, and procedural safeguards into one unifying model.
- Increasingly used for clinical risk management:
- Cybersecurity & Information Systems
- Modern Bow-Tie frameworks map how threats (phishing, misconfigurations, zero-day exploits) can bypass controls.
- Mitigations include detection systems, response plans, backups, and resilience architectures.
- Especially valuable in safety-critical cyber-physical systems (SCADA, medical devices, autonomous vehicles).
- Manufacturing, Rail, Maritime, and Energy
- Used where regulatory safety cases require clear visualization of hazard pathways.
- Bow-Tie supports audits, training, HAZOP/LOPA integration, and performance monitoring.
C. Clarifies Relationships Between Threats, Barriers, and Outcomes
- Threats (Causes)
- The left side organizes all plausible initiators of the top event:
- equipment failures
- human/organizational errors
- environmental extreme conditions
- cybersecurity incursions
- By structuring threats like an FTA, Bow-Tie identifies minimal cut sets and vulnerabilities.
- The left side organizes all plausible initiators of the top event:
- Preventive Barriers (Defenses Before the Event)
- These are controls designed to prevent threats from escalating into the top event:
- alarms
- interlocks
- procedural checks
- supervision
- training
- maintenance
- Bow-Tie emphasizes the quality, independence, and fragility of these barriers.
- These are controls designed to prevent threats from escalating into the top event:
- Mitigative Barriers (Defenses After the Event)
- Since no system is perfect, mitigations reduce the severity of outcomes when the top event happens:
- emergency shutdown systems
- fire suppression
- evacuation plans
- fail-safe defaults
- backup systems and redundancies
- rapid recovery protocols
- This dual structure reinforces the need for both prevention and resilience.
- Since no system is perfect, mitigations reduce the severity of outcomes when the top event happens:
- Consequences (Potential Outcomes)
- Situates outcomes along a spectrum from minor disruptions to fatal or catastrophic events.
- Helps leaders prioritize resources for high-risk scenarios.
- Human and Organizational Factors Integrated Throughout
- Bow-Tie diagrams reveal where culture, workload, communication, and competence influence barrier performance.
- This supports deeper RCA by linking behavior, system design, and accident pathways.
- Why Bow-Tie Is So Effective
- Combines clarity with completeness.
- A powerful communication tool for both technical and non-technical audiences.
- Helps teams identify barrier degradation, dependencies, and “weak signals” of failure.
- Bridges the gap between risk assessment, operations, and continuous improvement.

X. STAMP / STPA (Systems-Theoretic Accident Model and Processes) — Modern RCA Beyond the Traditional Tools
(From Nancy Leveson’s Engineering a Safer World*)*
A. Why Traditional RCA Doesn’t Work for Complex Systems
- Traditional RCA Assumes Linear, Sequential Causation
- Tools like the 5 Whys, Fishbone, FMEA, and even FTA are grounded in mechanical-era thinking—when failures were physical, isolated, and mostly predictable.
- These methods assume accidents arise from a chain of events: A → B → C → failure.
- But in modern AI-driven, software-intensive, human-involved systems, causation is non-linear, cyclic, emergent, and distributed.
- Modern Systems Are Socio-Technical, Dynamic, and Tightly Coupled
- Systems today include:
- humans
- software
- sensors
- algorithms
- organizational policies
- external regulators
- interfaces
- training systems
- These interact in ways that defy linear models.
- Failures often arise from:
- incorrect assumptions
- delayed feedback
- conflicting goals
- organizational pressures
- algorithmic blind spots
- degraded communication channels
- Leveson argues that traditional RCA can diagnose symptoms but not the systemic roots of failure.
- Systems today include:
B. STAMP Principles
STAMP (Systems-Theoretic Accident Model and Processes) reframes safety as a control problem, not a component reliability problem.
- Systems Fail Due to Inadequate Control, Not Component Failure Alone
- Accidents occur when safety constraints (rules that keep the system within safe boundaries) are not properly enforced.
- Failures emerge from inadequate:
- control actions
- feedback loops
- process models
- coordination
- authority structures
- Example: A perfectly functioning device can still cause harm if the operator misunderstands its state (bad feedback loop).
- Focus on Constraints, Control Loops, and Communication Paths
STAMP analyzes:- Controllers (humans, software, management, regulators)
- Control actions
- Sensors/feedback
- Process models (mental or algorithmic models of how the system works)
- Communication and coordination pathways
- Constraints that prevent hazards
Instead of simplifying the system, STAMP requires understanding how information, authority, and decision-making flow across layers.
C. STPA (Systems-Theoretic Process Analysis)
STPA is the actionable method built on STAMP. It is one of the most powerful RCA and hazard analysis techniques available for modern systems.
STPA proceeds through three main steps:
- Identify Unsafe Control Actions (UCAs)
A control action becomes unsafe if:- It is provided when unsafe.
- It is not provided when needed.
- It is provided too early, too late, or in the wrong sequence.
- It is applied for too long or not long enough.
This alone uncovers a vast number of hazards that traditional tools miss—especially in software and human–automation interactions.
- Analyze Causal Scenarios
For each unsafe control action, STPA explores why it may occur:- flawed process models (software miscalculations, human mental model errors)
- missing or delayed feedback
- inadequate communication
- ambiguous human–machine interface
- conflicting goals (production pressure vs. safety)
- poorly defined responsibility or authority
- algorithmic opacity
- cultural factors
These causal pathways expose hidden risks not accessible to even advanced statistical RCA.
- Design Constraints and Controls to Prevent Hazards
Once unsafe scenarios are identified, STPA prescribes:- new safety constraints
- improved control logic
- interface redesign
- alerting/feedback enhancements
- changes in procedures
- organizational reforms
- training and competency measures
- improved regulations, governance, or oversight
STPA focuses on system redesign, not patching component-level failures.
D. Why This Matters for AI, Healthcare, Aviation, and Education Systems
STPA is revolutionizing risk assessment in domains where complexity, software, and human factors dominate.
- Artificial Intelligence and Autonomous Systems
- AI failures rarely stem from broken components; they arise from flawed assumptions, data biases, missing feedback, or unsafe decision-making logic.
- STPA helps map:
- unsafe AI decisions
- control loops between humans and algorithms
- degraded feedback in autonomous systems
- algorithmic uncertainty and drift
- governance and oversight gaps
- Crucial for robotics, autonomous vehicles, and decision-support systems.
- Healthcare and Clinical Safety
- Healthcare is a deeply socio-technical system.
- STPA uncovers issues like:
- incorrect interpretation of monitoring data
- breakdowns in nurse–doctor communication
- alarm fatigue
- mismatched expectations between humans and devices
- Moves beyond blaming individuals toward redesigning workflows, interfaces, and team interactions.
- Aviation and Aerospace Safety
- Aviation increasingly depends on automation, autopilot logic, and multi-layered communication chains.
- STPA addresses failures from:
- automation confusion
- pilot mental model mismatches
- inadequate mode awareness
- complex system interactions (e.g., MCAS, AF447 scenarios)
- Many regulators now recommend STPA for certification of advanced systems.
- Education Systems and Large-Scale Social Systems
- Education is a complex adaptive system: teachers, students, policies, social pressures, technology, and cultural expectations.
- Failures—dropouts, inequity, skill mismatch—result from structural control issues, not individual “deficiencies.”
STPA offers a way to redesign:- feedback mechanisms (student performance ➝ teacher adaptiveness)
- governance loops
- resource allocation controls
- digital learning interfaces
- policies that produce unintended consequences
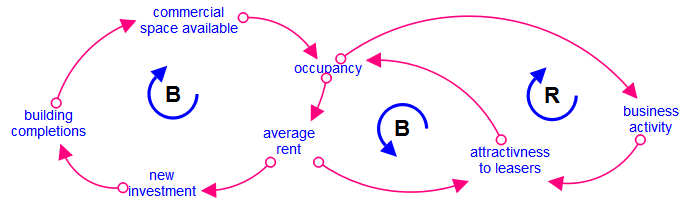
XI. Causal Loop Diagrams & Systems Thinking (Gharajedaghi)
(Inspired by Jamshid Gharajedaghi’s Systems Thinking: Managing Chaos and Complexity)
A. When Problems Are Dynamic, Non-Linear, and Self-Reinforcing
Conclusion: Causal Loop Diagrams (CLDs) are essential when root causes are not static factors but moving patterns, where today’s solutions become tomorrow’s problems.
Why & What:
- Many failures arise from interactions, not isolated events.
- Gharajedaghi emphasizes that real-world problems have interdependencies, counterintuitive behaviors, and continuous feedback loops.
- CLDs help decode the “structure → behavior” relationship that traditional RCA tools cannot reveal.
B. Understanding Feedback Loops, Time Delays, and Unintended Consequences
Conclusion: CLDs reveal how actions ripple through a system, sometimes creating effects that are delayed, amplified, or reversed.
Why & What:
- Reinforcing loops (R-loops): escalate situations (e.g., panic–selling spirals, burnout cycles).
- Balancing loops (B-loops): stabilize systems (e.g., thermostat control, regulatory checks).
- Time delays: create system oscillations, overshoots, and instability.
- Understanding these helps avoid solutions that “feel right but fail,” a concept Gharajedaghi stresses repeatedly.
C. Identifying Leverage Points for Lasting, Structural Change
Conclusion: CLDs enable leaders to intervene where it truly counts—not at the symptom level but at systemic leverage points.
Why & What:
- Helps uncover where a small shift in system structure yields disproportionate impact.
- Examples of leverage points:
- Information flows
- Decision-making rules
- Incentive structures
- Cultural assumptions
- This aligns with Donella Meadows’ systems leverage insights, often referenced in Gharajedaghi’s work.
D. Ideal for Organizational Change, Policy Design, and Large-Scale Social Issues
Conclusion: CLDs are indispensable when navigating complex domains where human behavior, institutions, and processes intertwine.
Why & What:
- Organizational transformation: diagnosing resistance, burnout, misaligned incentives.
- Public policy: health systems, traffic congestion, education reform—where linear RCA fails.
- Social issues: poverty cycles, addiction, environmental degradation—problems driven by reinforcing loops.
- CLDs offer a visual, shared mental model to unify diverse stakeholders, reducing blind spots.
XII. Integrating RCA Tools: A Practical Framework
A unified, real-world approach for complex, multi-factor failures
A. Step-by-Step Integrated Workflow
Conclusion: Effective RCA is never a single tool—it is a structured sequence, moving from chaos → clarity → controls → learning.
Below is a robust, industry-proven workflow that integrates classical and modern root-cause tools.
1. Start with Containment Actions (Immediate Risk Control)
- Stop the bleeding while you investigate.
- Protect people, assets, customers, and the environment.
- Document emergency decisions—these often reveal early clues.
2. Use Pareto Analysis for Problem Prioritization
- Before diving deep, identify which problems matter most.
- Apply 80/20 thinking: Which defect types drive most impact?
- Helps allocate resources, avoid analysis paralysis.
3. Use Fishbone (Ishikawa) for Categorical Scanning
- Map the broad universe of potential causes.
- Categorize across Methods, Machines, Material, Manpower, Measurement, Environment.
- Ideal for brainstorming and cross-functional engagement.
4. Use 5 Whys to Drill Down Into the Most Probable Branches
- Focus only on top contributors from the Ishikawa diagram.
- Avoid “one chain to rule them all”—use multiple parallel Why-chains where needed.
- Ensure each “Why” is validated with evidence, not intuition.
5. Apply FMEA / FTA / Barrier Analysis Based on Complexity
Choose the right depth for the right problem:
- FMEA: When dealing with process weaknesses, design vulnerabilities, repeat failures.
- FTA: When dealing with catastrophic outcomes or safety-reportable events.
- Barrier Analysis (Bow-Tie or STAMP): When human, technical, and organizational layers interact.
This step separates simple linear causes from complex systemic scenarios.
6. Validate Findings Using Statistical Tools
- Scatter plots, regression, hypothesis testing to confirm relationships.
- Apply Measurement System Analysis (MSA) if data reliability is questionable.
- Avoid spurious conclusions—correlation ≠ causation (reaffirmed across CQE methodology).
7. Document Using Causal Maps, Causal Trees, or Bow-Tie Analysis
- Convert the analytical journey into a clear visual narrative.
- Bow-Tie clarifies threats → event → consequences, including preventive and mitigative barriers.
- Causal maps help communicate to leadership and regulators.
8. Implement CAPA (Corrective and Preventive Actions)
- Corrective = Fix identified root causes.
- Preventive = Strengthen controls to avoid recurrence, even in similar processes.
- Ensure actions address systemic factors, not just symptoms.
- Cross-reference ISO standards: CAPA effectiveness is mandatory in regulated industries.
9. Conduct Effectiveness Review (30–90 Days)
- Did the problem recur?
- Did the risk score (RPN / risk priority) go down?
- Were unintended side-effects created?
- This is where most RCA efforts fail—skipping this step turns RCA into paperwork.
B. Example: Combined RCA Approach for a Real Industry Problem
Case: High defect rate in an automotive assembly line’s electronic control unit (ECU) testing stage.
1. Containment
- Halt shipment of suspect batch.
- Increase sampling to 100% inspection.
- Segregate high-risk serial numbers.
2. Pareto Analysis
- Identify that ECU communication failure accounts for 62% of all testing rejects.
3. Fishbone Analysis
Key branches emerge:
- Machine: Aging test rig, intermittent probe contact.
- Material: Variability in PCB supplier’s solder joints.
- Method: Operator steps differ between shifts.
- Environment: Humidity spikes during night shift.
4. 5 Whys on the Top Two Branches
Branch 1 — Machine:
- Why fail? Probe contact unstable → probe wear.
- Why wear? Maintenance cycle exceeded → poor tracking.
- Why poor tracking? No digital PM system.
Branch 2 — Material:
- Why solder cracks? Poor wetting.
- Why wetting poor? Supplier changed flux chemistry.
- Why change? Cost-saving initiative without notifying OEM.
5. FTA + Barrier Review
FTA shows two critical paths leading to ECU test failure:
- Probe degradation path
- PCB solder-wetting path
Barrier analysis reveals missing controls: - No supplier change control barrier
- No preventive maintenance digital alert barrier
6. Statistical Validation
- Regression confirms humidity correlates strongly with communication failures but is not the root cause, merely an amplifier.
- Measurement System Analysis confirms tester repeatability issues.
7. Bow-Tie Documentation
- Left side: threats = probe wear, solder cracks, humidity variation.
- Right side: consequences = false failures, rework cost, delayed shipment.
- Barriers identified for strengthening.
8. CAPA Implementation
Corrective:
- Replace probes, recalibrate rigs.
- Reject defective PCB lot.
Preventive: - Introduce supplier change-control SOP.
- Implement digital PM scheduling system.
- Add humidity control sensors.
9. Effectiveness Review (60 Days)
- Test reject rate drops from 8.4% → 1.1%.
- No recurrence across three production cycles.
- Supplier audit confirms compliance.

XIII. CAPA: Converting Insights into Long-Term Solutions
A disciplined pathway from understanding root causes to ensuring the problem never returns.
A. Corrective vs. Preventive Actions (CQE Handbook Distinction)
Conclusion: Effective CAPA depends on clear conceptual separation—something most organizations fail to enforce.
The CQE Handbook draws a sharp line that should govern every quality system:
1. Corrective Action — Fixing What Happened
- Triggered by a nonconformance or failure that has already occurred.
- Objective: Eliminate the root cause and prevent recurrence.
- Example: Replacing worn probes and updating the digital PM system after a test failure.
2. Preventive Action — Strengthening the System Against What Could Happen
- Triggered by risk analysis, not events.
- Objective: Proactively eliminate potential causes before they manifest.
- Example: Implementing supplier change-control procedures before any quality escape happens.
3. Why Mixing These Two Is Dangerous
- Corrective = event-driven; Preventive = risk-driven.
- Combining them leads to reactive systems that can never become resilient.
- Also creates documentation ambiguity, compliance gaps, and leadership misunderstandings.
This distinction is central to ISO, CQE methodology, and the philosophy of continuous improvement.
B. Why CAPA Fails in Most Organizations
Conclusion: CAPA rarely fails because the tools are weak—it fails because organizations are weak at discipline, culture, and execution.
Below are the most common failure patterns, all repeatedly documented in the CQE Handbook, FDA Warning Letters, and industry CAPA audits.
1. Symptoms, Not Root Causes, Are Addressed
Teams fix what is visible and urgent, not the systemic factors that allowed the issue to occur.
The result? Recurring firefighting disguised as problem-solving.
2. Weak Problem Statements
Poorly defined problems → Poor CAPA.
Ambiguous scope leads to misguided actions and lack of measurable success criteria.
3. Ineffective or Missing Verification/Validation
Organizations jump from “action implemented” to “problem solved” without evidence.
This violates ISO expectations and guarantees recurrence.
4. CAPA Treated as an Administrative Task
CAPA becomes paperwork for auditors instead of a weapon for operational excellence.
This cultural decay renders even strong technical teams ineffective.
5. Over-Reliance on Tools, Under-Reliance on Thinking
Teams “do the forms” but fail to think critically:
- Was the root cause truly systemic?
- Have all interactions been considered?
- Will the fix survive workforce changes, vendor transitions, and market variation?
6. Lack of Leadership Ownership
When CAPA rests with quality alone, it collapses under organizational apathy.
Cross-functional ownership is mandatory.
7. No Metrics or Feedback Loops
Without measurable KPIs, organizations cannot know whether CAPA is effective.
This contradicts both statistical process control principles and systems-thinking theory.
The bottom line?
CAPA fails because organizations avoid uncomfortable truths.
C. Building Habits of Verification, Validation, and Follow-Through
Conclusion: CAPA succeeds only when the organization treats it as a habit—not an event.
Verification and validation are the spine of a successful CAPA system. Organizations must institutionalize them as daily discipline.
1. Verification: Did We Implement the Action Correctly?
Checks that the process change was executed as intended.
- Was the SOP updated?
- Was training completed and competency verified?
- Were physical or digital controls installed and tested?
Verification ensures integrity of action.
2. Validation: Did the Action Actually Work?
Checks effectiveness in real operational conditions.
- Did defect rates reduce?
- Did customer complaints decrease?
- Did failure modes truly disappear?
- Did new unintended consequences arise?
Validation ensures impact, not just activity.
3. Build Organizational Routines That Force Discipline
- CAPA Review Board (CRB): Cross-functional governance.
- 30/60/90-day reviews: To confirm sustained performance.
- Trigger thresholds: Automatically initiate CAPA from data patterns.
- Annual CAPA Effectiveness Audits: Required in mature systems.
- Integration with risk management: CAPA must feed back into FMEA, STPA, Bow-Tie, etc.
4. Embed Systems-Thinking in CAPA Culture
Borrowing from Leveson and Gharajedaghi:
- Check whether failures came from control loops, not just components.
- Check for feedback delays that distort perception of improvement.
- Look for reinforcing loops that may recreate the problem later.
5. Make Follow-Through Non-Negotiable
Real CAPA systems penalize non-completion and reward effectiveness, not speed.
Preventive actions especially require leadership-level follow-through.
XIV. Future of RCA in the Age of AI and Automation
RCA is evolving from a human-driven investigative discipline into an AI-augmented, predictive, self-correcting ecosystem. The future belongs to organizations that use machine intelligence not to replace human judgment, but to amplify foresight, reduce noise, and eliminate systemic blind spots. Below is a detailed and forward-looking breakdown of how RCA is transforming in the age of AI.
A. Predictive Failure Models Using Machine Learning
Conclusion: Machine learning will allow organizations to detect failures before they occur, shifting RCA from detective work to anticipatory engineering.
1. Data Sources Feeding Predictive RCA Models
- Sensor telemetry (IoT, SCADA, MES)
- Operator logs and HMI interactions
- Supplier and process-quality variability
- Environmental and contextual data (temperature, vibration, usage cycles)
- Historical maintenance and CAPA records
- ERP and inventory conditions
When fused, these data streams generate powerful anomaly detection and risk-probability models.
2. Types of Models Becoming Standard
- Supervised learning: predicting known failure modes
- Unsupervised clustering: discovering new failure patterns not documented in FMEA
- Deep learning and temporal models (LSTM/Transformers): understanding long-term degradation trends
- Hybrid physics + ML models: combining engineering constraints with predictive analytics
3. Strategic Implications
- Earlier detection → lower cost of intervention
- Better prediction → fewer catastrophic failures
- Smarter resource allocation → aligns perfectly with Lean and TPM principles
- Reduction of human fatigue in monitoring
This positions AI as the natural evolution of reliability engineering, not a competitor to it.
B. Automated QMS Workflows
Conclusion: Automation will transform QMS from a reactive document repository into a living, self-updating control system.
1. Workflow Automation Trends
- Digital CAPA triggers: automated initiation when statistical limits are crossed
- Real-time document control: SOP updates cascaded instantly across sites
- Automated training assignment: competency gaps identified and closed automatically
- Closed-loop nonconformance handling: automatic pairing of deviations with risk and impact assessments
2. Integration Across Systems
Modern QMS platforms are now integrating:
- Manufacturing Execution Systems (MES)
- Asset Management / CMMS
- Supplier Quality Portals
- Risk Management Systems (FMEA/FTA/STPA)
- Customer Complaint Portals
The result is a unified view of quality at both macro and micro scales.
3. What Automation Solves
- Manual errors
- Delayed reporting
- Documentation gaps
- Compliance failures
- Inconsistent follow-through
4. What Still Requires Human Leadership
- Ethical judgment
- Organizational culture
- Risk appetite
- Interpretation of systemic patterns
- Designing preventive strategies
AI handles the mechanics; humans handle the meaning.
C. AI-Assisted Causal Graphing and Log Analysis
Conclusion: AI will revolutionize RCA by building causal maps faster, deeper, and more reliably than human teams could ever do manually.
1. Automated Causal Graphing
Systems will ingest:
- Event logs
- Sensor patterns
- Maintenance records
- Operator actions
- Digital audits
- Barrier states
- Control structure diagrams
AI then generates:
- Causal graphs
- Bow-Tie visualizations
- Fault Trees
- Interactive Ishikawa diagrams
- STPA-based unsafe control action models
2. AI Strengthens, Not Replaces, Human RCA
Because AI can detect hidden correlations, repeating cycles, and multi-variable interactions that humans easily overlook.
However, causation still requires human contextual intelligence, domain knowledge, and ethical awareness.
3. Log Analysis Made Actionable
AI conducts:
- Pattern recognition
- Outlier analysis
- Sequence mining
- Time-series anomaly detection
- Predictive failure scoring
This dramatically reduces investigative time and surfaces latent risks early.
D. The Shift from Reactive to Predictive Reliability Engineering
Conclusion: The world is moving toward self-correcting systems that anticipate failure modes, modify themselves, and continuously improve without human prompting.
1. From Post-Event RCA to Real-Time RCA
Historically:
- A failure happens → Investigators analyze → Improvements are implemented.
Future state:
- AI detects a risk → Predicts the failure mode → Suggests or triggers preventive actions.
2. Emergence of “Digital Twins” for Safety and Reliability
Digital twins simulate:
- Process flow
- Failure propagation
- Control loop interactions
- Human-machine interfaces
- Environmental changes
They can run millions of “what-if” scenarios to identify previously invisible hazards.
3. Self-Healing Systems
Inspired by cyber-physical systems and AI safety loops:
- Systems auto-adjust parameters
- Re-route tasks
- Slow down cycle time
- Activate additional barriers
- Notify operators before adverse events occur
This is Leveson’s safety control theory brought to life with machine intelligence.
4. Cultural and Organizational Implications
RCA will evolve from:
- Investigation → Prediction
- Corrective reaction → Proactive prevention
- Blame → System learning
- Local fixes → Network optimization
Leaders must prepare for a world where RCA is continuous, automated, and embedded in the operational DNA.

XV. Conclusion
Effective Root Cause Analysis is not a toolbox—it is a mindset, a discipline, and a cultural operating system. Organizations that adopt a multi-method, evidence-driven, and systems-oriented approach to RCA become more resilient, humane, efficient, and future-ready. The journey begins with curiosity, grows through structure, and matures through continuous learning and feedback.
A. Key Takeaways
- RCA requires a blend of logic, evidence, systems thinking, and human insight.
Root Cause Analysis is at its best when it harmonizes analytical reasoning with the human factors that influence real-world operations. Logical rigor ensures clarity, evidence ensures truth, systems thinking ensures depth, and human insight ensures relevance. Together, they create a balanced approach that penetrates beyond symptoms to the deep architecture of failure. - No single tool is sufficient for all problems.
Every tool solves a different class of issue:
- 5 Whys for linear logic
- Fishbone for multi-dimensional brainstorming
- FMEA and FTA for structured engineering analysis
- STAMP/STPA for complex socio-technical systems
- Statistical tools for validation
- Bow-Tie and Barrier Analysis for risk visualization
- Causal Loops for dynamic, policy-level challenges
Mastery comes from selecting the right tool—or combination of tools—based on system complexity, data availability, and risk profile.
- Organizations that master RCA gain resilience, efficiency, and operational harmony.
When RCA becomes a cultural norm rather than a compliance requirement:
- Mistakes turn into learning
- Systems become self-improving
- Waste reduces dramatically
- Safety improves
- Productivity rises
- Teams align around shared purpose
The long-term payoff is not just fewer failures—it’s organizational calm, clarity, and confidence.
B. Participate and Donate to MEDA Foundation
Root Cause Analysis at its core is about removing barriers—not just in machines and processes, but also in human lives. The MEDA Foundation embodies this spirit by empowering autistic individuals, creating inclusive employment opportunities, and building sustainable ecosystems where people can thrive with dignity.
If this article added value to your thinking, I warmly encourage you to support the MEDA Foundation’s transformational mission.
Your contribution—financial or participatory—helps build a world where every individual is recognized, included, and empowered.
C. Book References
- Root Cause Analysis: Improving Performance for Bottom-Line Results – Robert & Kenneth Latino
A foundational guide to evidence-based RCA, emphasizing causal chains, human contributors, and organizational learning. - The Certified Quality Engineer Handbook – Connie M. Borror
A comprehensive technical reference covering statistical tools, quality engineering methods, FMEA, CAPA, and risk-based improvement. - Engineering a Safer World – Nancy Leveson
The definitive resource on modern safety engineering, introducing STAMP/STPA and redefining accident analysis for complex socio-technical systems. - Toyota Production System – Taiichi Ohno
The philosophical backbone of Lean thinking—clarity, simplicity, respect for people, and relentless pursuit of root causes. - Systems Thinking: Managing Chaos and Complexity – Jamshid Gharajedaghi
A deep exploration of multi-loop systems, feedback, and dynamic complexity—essential for understanding high-level failures and designing resilient solutions.


